Understanding Financial Ratios: A Comprehensive Guide
Financial ratios are key for checking a company’s health and how well it’s doing. They come from the company’s financial statements. These numbers give deep insights into things like how liquid the company is, its debt, how efficient it is, and its profits.
It’s vital for everyone involved with the company to know about financial ratios. This includes the management, investors, and creditors. They use these metrics to make smart choices about the company’s future and how to invest in it.
Key Takeaways
- Financial ratios are numerical values calculated from a company’s financial statements to provide insights into its performance and financial health.
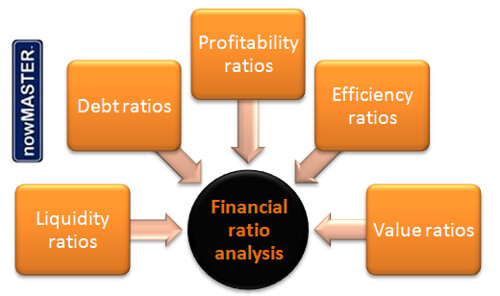
- Ratios are grouped into categories such as liquidity, leverage, efficiency, profitability, and market value.
- Financial ratio analysis serves two main purposes: tracking company performance over time and making comparative judgments about a company’s performance relative to competitors or industry averages.
- Users of financial ratios include external parties like financial analysts, investors, and creditors, as well as internal users like management and owners.
- Understanding financial ratios is crucial for making informed investment decisions and assessing a company’s overall financial well-being.
What Are Financial Ratios?
Financial ratios are tools that use data from a company’s financial statements. These include the balance sheet, income statement, and cash flow statement. They help check a company’s health by looking at its liquidity, leverage, efficiency, profitability, and market value. Investors, analysts, and management use these ratios to make smart financial choices.
Types of Financial Statements
The main financial statements for ratio analysis are:
- Balance sheet: Shows a company’s assets, liabilities, and equity at one point in time.
- Income statement: Details a company’s earnings, costs, and net income over a period.
- Cash flow statement: Shows the cash coming in and going out of a company over a period.
Purpose of Financial Ratios
Financial ratio analysis helps track a company’s performance over time. It lets investors, analysts, and management see how they stack up against others or industry standards. This helps spot strengths and weaknesses. It aids in making smart decisions about a company’s financial health and future.
These ratios look at a company’s liquidity, leverage, efficiency, profitability, and market value. They give a full picture of its financial health and potential. By looking at these ratios, stakeholders can make better choices about investing, financing, and operations.
| Ratio Type | Purpose |
|---|---|
| Liquidity Ratios | Check if a company can pay its short-term debts |
| Leverage Ratios | See how much debt a company uses to run its operations |
| Efficiency Ratios | Look at how well a company uses its assets and runs its operations |
| Profitability Ratios | See if a company makes profits from its operations |
| Market Value Ratios | Check how a company’s stock is doing and its value |
Knowing about financial ratios and their uses helps investors, analysts, and management. They can make better financial decisions. These decisions match the company’s goals and objectives. As Virtual CFO at DeshFilings, we analyze ratios and help businesses in finance.
Liquidity Ratios
Liquidity ratios are key financial metrics. They show how well a company can pay its short-term debts. These ratios help us see if a company can quickly turn assets into cash to pay its bills. The main liquidity ratios are the current ratio, quick ratio, and cash ratio.
Current Ratio
The current ratio is found by dividing current assets by current liabilities. It tells us if a company has enough resources to pay its short-term debts. A ratio of 1.0 or more means the company can cover its debts.
Quick Ratio
Also called the acid-test ratio, this quick ratio is stricter. It leaves out inventory because it’s not always easy to turn into cash. To calculate it, you divide current assets (minus inventory) by current liabilities. A ratio of 1.0 or higher shows strong short-term liquidity.
Cash Ratio
The cash ratio is the most strict, focusing only on cash and cash equivalents against current liabilities. It shows how well a company can pay its debts with its most liquid assets. A cash ratio of 0.5 or higher is seen as a good liquidity level.
Looking at these ratios helps investors and analysts understand a company’s short-term financial health. They see if a company can pay its bills on time. These ratios are key for checking how well a company manages its working capital and its risk of short-term problems or economic downturns.
| Liquidity Ratio | Calculation | Interpretation |
|---|---|---|
| Current Ratio | Current Assets / Current Liabilities | Measures a company’s ability to pay short-term obligations. A ratio of 1.0 or higher is generally considered healthy. |
| Quick Ratio (Acid-Test Ratio) | (Current Assets – Inventory) / Current Liabilities | A more stringent measure of liquidity, excluding inventory. A ratio of 1.0 or higher is generally considered a sign of strong short-term liquidity. |
| Cash Ratio | Cash & Cash Equivalents / Current Liabilities | The most conservative liquidity ratio, considering only the most liquid assets. A ratio of 0.5 or higher is typically viewed as a healthy level of liquidity. |
Looking at these liquidity ratios gives us deep insights into a company’s short-term financial health. It shows if a company can pay its bills on time. By knowing a company’s liquidity, investors and analysts can make better decisions about its financial stability and growth.
Leverage Ratios
Companies often use both equity and debt to finance their work. Leverage ratios show how much debt a company uses to fund its assets. These ratios help us see if a company is stable financially and can pay off its debts.
The debt-to-equity ratio compares a company’s debt to its equity. It shows how much debt versus equity a company uses. A high ratio means more debt, which can be risky but might also lead to higher returns.
The debt-to-assets ratio looks at how much debt finances a company’s assets. This ratio tells us about the company’s financial leverage and its ability to handle tough times.
The interest coverage ratio checks if a company can pay its debt interest. It compares the company’s income to its interest costs. This tells us if the company can afford its debt payments.
Also, the debt service coverage ratio and the fixed charge coverage ratio look at a company’s long-term debt payments. They see if the company can pay its interest and principal.
By looking at these leverage ratios, people can understand a company’s finances, risks, and health. This info helps with making smart investment, lending, or planning decisions.
“The key to financial freedom is to live life on your own terms and not on someone else’s.”
Efficiency Ratios
Financial ratios are key in checking how well a company uses its resources. Efficiency ratios, or activity ratios, show how well a business uses its assets to make sales. They help spot areas that could be better.
Asset Turnover Ratio: Measuring Asset Utilization
The asset turnover ratio shows how well a company uses its assets to make money. It’s found by dividing net sales by average total assets. A higher ratio means the company uses its assets more efficiently, making more sales from what it has.
Inventory Turnover Ratio: Evaluating Inventory Management
The inventory turnover ratio looks at how well a company manages its stock. It’s figured out by dividing the cost of goods sold by the average inventory. A high ratio means the company sells its products quickly, using less capital on unsold items.
Receivables Turnover Ratio: Monitoring Credit Management
The receivables turnover ratio helps check how well a company manages its debts. It’s found by dividing net credit sales by average accounts receivable. A high ratio means the company pays its customers on time, using less capital on debts.
| Efficiency Ratio | Formula | Interpretation |
|---|---|---|
| Asset Turnover Ratio | Net Sales / Average Total Assets | Shows how well a company uses its assets to make sales. A higher ratio means better asset use. |
| Inventory Turnover Ratio | Cost of Goods Sold / Average Inventory | Looks at inventory management. A high ratio means better inventory management. |
| Receivables Turnover Ratio | Net Credit Sales / Average Accounts Receivable | Sheds light on credit management. A high ratio means better credit management. |
By looking at these efficiency ratios, companies can learn a lot about their asset utilization, inventory management, and credit management. This helps them make better decisions and find ways to grow and make more money.
Profitability Ratios
Profitability ratios are key for checking how well a company makes profits and earnings. They show how well a business does financially and its growth potential. The main ratios to look at are the gross margin ratio, operating margin ratio, and return on assets (ROA).
Gross Margin Ratio
The gross margin ratio shows what part of revenue a company keeps after direct costs. It’s found by dividing gross profit by net sales. A high ratio means the company is good at pricing and managing costs well.
Operating Margin Ratio
The operating margin ratio looks at revenue after paying for operating costs like salaries and rent. It’s the operating income divided by net sales. A high ratio means the company makes good profits from its main operations.
Return on Assets (ROA)
Return on assets (ROA) shows how well a company uses its assets to make net income. It’s net income divided by total assets. A high ROA means the company uses its assets well to make profits, which is good for its financial health and growth.
By looking at these ratios, investors, lenders, and leaders can understand a company’s financial health and profit-making ability. This helps with making strategic decisions and finding areas to improve or grow.
Market Value Ratios
Market value ratios are key financial tools. They help figure out a company’s stock price and its investment potential. These ratios show how the market sees the company’s performance and future. The price-earnings ratio and the dividend yield ratio are two main ratios used.
Price-Earnings Ratio
The price-earnings (P/E) ratio is found by dividing the stock price by its earnings per share (EPS). It shows what investors pay for each dollar of earnings. A high P/E ratio means the stock might be overvalued. A low P/E ratio could mean it’s undervalued. Investors use this ratio to compare companies in the same industry.
Dividend Yield Ratio
The dividend yield ratio is the annual dividend per share divided by the stock price. It shows the return on investment from dividends. A high dividend yield means the stock is seen as undervalued. A low yield could mean it’s overvalued or has low dividends.
These market value ratios help investors and analysts understand a company’s stock valuation. They make it easier to make smart investment choices. By looking at these metrics, they can see how the market views the company’s performance and potential.
“Investing in stocks without research is like playing poker without looking at your cards.” – Peter Lynch
Understanding Financial Ratios: A Comprehensive Guide
Financial ratios are key tools that help us understand a company’s health and potential. This guide will cover the different types of financial ratios and how they help in analyzing businesses.
These ratios use financial data from financial statements like the balance sheet and income statement. They help us look at liquidity, leverage, efficiency, profitability, and market value. By using these metrics, investors and analysts can better understand a company’s financial health and future.
Liquidity Ratios
Liquidity ratios show how well a company can pay its short-term debts. The current ratio and quick ratio are common ones. They tell us about a company’s cash flow and its ability to pay off debts.
Leverage Ratios
Leverage ratios check a company’s debt levels and its ability to handle long-term debts. These ratios help us see how much debt a company uses and its financial risk.
Efficiency Ratios
Efficiency ratios look at how well a company uses its assets to make money. Ratios like the asset turnover ratio and inventory turnover ratio are examples. They show how effective a company is in using its assets.
Profitability Ratios
Profitability ratios measure a company’s profit-making ability. Ratios like the gross margin ratio and return on assets (ROA) show how well a company does financially.
Market Value Ratios
Market value ratios show what the stock market thinks of a company. Ratios like the price-earnings ratio help investors see a company’s value and growth potential.
Understanding financial ratios gives businesses and investors a full view of a company’s financial health. This helps in making better decisions, improving business performance, and making smart investments.
“Financial ratios are the foundation for understanding a company’s financial performance and making informed investment decisions.” – Warren Buffett, Legendary Investor
DuPont Analysis
Understanding a company’s financial performance is key. The DuPont analysis is a great way to do this. It breaks down a company’s return on equity (ROE) into three main parts: profit margin, asset turnover, and financial leverage.
Components of DuPont Analysis
The DuPont analysis looks at ROE through three main factors:
- Profit Margin: This shows how much net income a company makes from its sales. It tells us about pricing, cost control, and profit levels.
- Asset Turnover: This shows how well a company uses its assets to make sales. A high ratio means the company is using its assets well.
- Financial Leverage: This shows how much debt a company uses to run its operations. A high ratio means the company uses a lot of debt.
By looking at these three parts, we can understand a company’s profits better. For instance, a low profit margin might mean the company needs to work on costs. A low asset turnover could mean it needs to use its assets better.
| Ratio | Formula | Interpretation |
|---|---|---|
| Profit Margin | Net Income / Sales | Shows a company’s net income as a percentage of sales. It tells us about pricing, cost control, and profit levels. |
| Asset Turnover | Sales / Total Assets | Shows how well a company uses its assets to make sales. A high ratio means better asset use. |
| Financial Leverage | Total Assets / Shareholders’ Equity | Shows how much debt a company uses to run its operations. A high ratio means more financial leverage. |
Understanding the DuPont analysis helps investors and analysts see a company’s financial health and what drives its performance. This information can help with investment decisions.
“DuPont analysis is a powerful tool that provides a comprehensive understanding of a company’s profitability and financial performance.”
Ratio Interpretation and Benchmarking
Understanding financial ratios and comparing them to industry averages or competitors is key to smart financial decisions. Analysts look at both the numbers and how they change over time. This helps spot strengths and weaknesses in a business.
By comparing a company’s ratios to others in the industry, analysts can see how it stands financially. This financial ratio analysis and benchmarking helps find areas to get better and make smart choices.
Understanding Ratio Interpretation
Ratio interpretation means looking at financial ratios in the light of the company’s overall financial performance. This includes:
- Looking at the numbers to see the company’s financial health
- Watching how ratios change over time to spot trends
- Seeing how the company stacks up against others in the industry
The Importance of Benchmarking
Benchmarking a company’s financial ratios against others is key for decision-making. It lets analysts see how the company compares to its competitors. This helps them:
- Find out what the company does well or not so well
- See where the company leads or trails the industry
- Work on making the company stronger and more competitive
Good financial ratio analysis and benchmarking give a full picture of a company’s finances. This leads to better decisions and plans.
“Ratio interpretation and benchmarking are essential tools for understanding a company’s financial performance and making informed decisions.”
Conclusion
Financial ratios are key tools for analyzing a company’s health and potential. This guide has covered different types of ratios, like liquidity, leverage, and profitability. It helps readers understand how to use these ratios in business analysis.
By learning how to use these metrics, investors and managers can make better decisions. They can see how a company is doing now and what it might do in the future. Ratios help look at a company’s money situation, debt, and profits. They give a full picture of the company’s finances and point out areas to work on.
As the economy changes, knowing how to analyze financial data with ratios is more important than ever. This guide has given a strong base for grasping financial ratios and their importance. It shows how they help in making smart financial choices, planning investments, and improving business performance.
FAQ
What are financial ratios?
Financial ratios are tools that use a company’s financial statements. They help measure things like liquidity, leverage, efficiency, profitability, and market value. These ratios track a company’s performance and compare it to others in the same industry.
What are the main types of financial ratios?
There are several types of financial ratios. They include liquidity ratios, leverage ratios, efficiency ratios, profitability ratios, and market value ratios. Each type sheds light on different aspects of a company’s financial health and performance.
How are liquidity ratios used?
Liquidity ratios check how well a company can pay back debts, both short-term and long-term. Ratios like the current ratio and quick ratio show how well a company can handle its short-term financial needs. They look at cash flow and cash on hand.
What are leverage ratios, and how do they work?
Leverage ratios show how much debt a company uses to finance its assets. Ratios like the debt ratio and interest coverage ratio help understand a company’s financial stability. They show if a company can handle its long-term debts.
How do efficiency ratios assess a company’s performance?
Efficiency ratios check how well a company uses its assets and resources to make sales. Ratios like asset turnover and inventory turnover show how efficiently a company operates. They help understand how well a company manages its resources.
What do profitability ratios tell us about a company?
Profitability ratios look at how well a company makes profits from its operations. Ratios like gross margin and return on assets show a company’s financial health and growth potential. They help understand a company’s financial performance.
How are market value ratios used in stock valuation?
Market value ratios help evaluate a company’s stock price. Ratios like the price-earnings ratio and dividend yield show how investors see a company’s value. These ratios help investors understand a company’s stock potential.
What is DuPont analysis, and how does it work?
DuPont analysis breaks down a company’s return on equity into three parts: profit margin, asset turnover, and financial leverage. This method helps investors understand what makes a company profitable. It shows where a company can improve.
How can financial ratios be interpreted and benchmarked?
It’s important to understand and compare financial ratios to make smart financial decisions. Look at both the numbers and trends over time. Comparing to industry averages gives insights into a company’s financial strength and competitiveness.